- Research
- Open access
- Published:
Radiogenomics and machine learning predict oncogenic signaling pathways in glioblastoma
Journal of Translational Medicine volume 23, Article number: 121 (2025)
Abstract
Background
Glioblastoma (GBM) is a highly aggressive brain tumor associated with a poor patient prognosis. The survival rate remains low despite standard therapies, highlighting the urgent need for novel treatment strategies. Advanced imaging techniques, particularly magnetic resonance imaging (MRI), are crucial in assessing GBM. Disruptions in various oncogenic signaling pathways, such as Receptor Tyrosine Kinase (RTK)-Ras-Extracellular signal-regulated kinase (ERK) signaling, Phosphoinositide 3- Kinases (PI3Ks), tumor protein p53 (TP53), and Neurogenic locus notch homolog protein (NOTCH), contribute to the development of different tumor types, each exhibiting distinct morphological and phenotypic features that can be observed at a microscopic level. However, identifying genetic abnormalities for targeted therapy often requires invasive procedures, prompting exploration into non-invasive approaches like radiogenomics. This study explores the utility of radiogenomics and machine learning (ML) in predicting these oncogenic signaling pathways in GBM patients.
Methods
We collected post-operative MRI scans (T1w, T1c, FLAIR, T2w) from the BRATS-19 dataset, including scans from patients with both GBM and LGG, linked to genetic and clinical data via TCGA and CPTAC. Signaling pathway data was manually extracted from cBioPortal. Radiomic features were extracted from four MRI modalities using PyRadiomics. Dimensionality reduction and feature selection were applied and Data imbalance was addressed with SMOTE. Five ML models were trained to predict signaling pathways, with Grid Search optimizing hyperparameters and 5-fold cross-validation ensuring unbiased performance. Each model’s performance was evaluated using various metrics on test data.
Results
Our results showed a positive association between most signaling pathways and the radiomic features derived from MRI scans. The best models achieved high AUC scores, namely 0.7 for RTK-RAS, 0.8 for PI3K, 0.75 for TP53, and 0.4 for NOTCH, and therefore, demonstrated the potential of ML models in accurately predicting oncogenic signaling pathways from radiomic features, thereby informing personalized therapeutic approaches and improving patient outcomes.
Conclusion
We present a novel approach for the non-invasive prediction of deregulation in oncogenic signaling pathways in glioblastoma (GBM) by integrating radiogenomic data with machine learning models. This research contributes to advancing precision medicine in GBM management, highlighting the importance of integrating radiomics with genomic data to understand tumor behavior and treatment response better.
Introduction
Glioblastoma (GBM), a formidable malignancy originating from neural tissue within the brain, presents a significant challenge in oncology, representing nearly half of all primary brain tumors. Tragically, the prognosis for GBM patients remains bleak, with an average survival period of 15 to 20 months and a mere 5% exhibiting potential for remission over 3 to 5 years [1,2,3,4,5,6]. GBM cells exhibit elevated aggressiveness, resistance to standard therapies, and rapid proliferation, predominantly localized in the supratentorial region and frontal lobe [1, 3, 7]. Classified as a grade 4 malignancy by the World Health Organization (WHO), GBM demands urgent attention due to its devastating impact, especially in older individuals, with a median age of diagnosis at 64 years [8,9,10,11]. Over recent years, the incidence of GBM in the USA has been on the rise, with an estimated 14,190 new cases reported in 2022, reflecting a 12.1% increase compared to previous years. Despite following the standard clinical protocol involving surgical resection, chemotherapy, and radiotherapy, GBM patients continue to face a meager 5-year survival rate of only 6.9%, highlighting the urgent need for novel treatment strategies [12, 13].
Advanced imaging techniques such as magnetic resonance imaging (MRI) are crucial in accurately assessing glioblastoma. While these imaging modalities have greatly improved diagnosis, identifying genetic abnormalities for targeted therapy often necessitates invasive procedures, carrying significant risks [14,15,16]. A promising solution to these challenges lies in radiogenomics, a non-invasive approach that analyzes radiomic features extracted from various imaging modalities to detect and identify tumors. Radiogenomics combines genetics with radiomics, and artificial intelligence (AI), offering new possibilities for targeted therapy and precision medicine by enabling the identification of genetic profiles. By analyzing phenotypic data obtained from medical imaging, radiogenomics provides insights into tumor behavior and treatment response [17,18,19,20]. To enhance the predictive power of radiogenomics, machine learning algorithms, a subset of AI, are playing a vital role by virtue of their ability to excel at analyzing large, complex datasets to identify patterns and predict outcomes. When applied to radiogenomic data, ML models can link imaging features with specific genetic abnormalities. Recent studies have shown direct associations between tumors’ phenotypic and genotypic characteristics, sparking interest in extracting genotypic information from medical imaging techniques [21,22,23].
Oncogenic signaling pathways, regulate essential cellular processes such as growth, survival, and apoptosis. The disruption of signaling pathways such as Ras-ERK (extracellular signal-regulated kinase) and PI3K (phosphatidylinositol 3-kinase) can lead to abnormal cell behavior and contribute to cancer progression [24,25,26]. Targeted inhibition of these pathways using precision drugs offers a personalized treatment strategy [27, 28]. Glioblastoma, a formidable opponent in cancer research, effectively utilizes various signaling pathways to fuel cancerous cells’ continuous growth and survival. This coordinated network plays a crucial role in sustaining the aggressive behavior of the tumor. One of the main pathways is PI3K, which plays a vital role in glioblastoma’s pathophysiology. The PI3K pathway often becomes overactive due to the loss of the PTEN (Phosphatase and Tensin Homolog) tumor suppressor gene, promoting tumor growth [29]. Additionally, NOTCH (Neurogenic Locus Notch Homolog Protein) signaling, which is essential in gliomagenesis, interacts with the TP53 pathway, affecting cell death [30,31,32,33]. Unfortunately, TP53 (Tumor protein 53), a vital tumor suppressor, is frequently disrupted in GBM [29]. Furthermore, The Receptor tyrosine kinase (RTK-RAS) pathway, commonly altered in glioblastoma, is linked to overactive RTK receptors, further fueling the complexity of the disease [34,35,36]. Moreover, WNT signaling, essential for CNS development, becomes dysregulated in GBM, especially in glioblastoma stem cells (GSCs), which contributes to tumor growth and makes it resistant to drugs [37,38,39,40]. Traditionally, identifying these pathways relies upon gene expression analysis, a laborious and resource-intensive process [41]. However, the advent of radiomics holds immense promise in revolutionizing GBM management. By utilizing imaging modalities like MRI, radiomics facilitates non-invasive elucidation of underlying molecular processes, potentially offering personalized treatment strategies and substantially enhancing patient outcomes. In this context, our study explores the utility of radiogenomics and machine learning (ML) in predicting oncogenic signaling pathways in GBM. By extracting radiomic features from MRI scans and integrating them with genomic data, we aim to identify associations between imaging phenotypes and genetic profiles, mainly focusing on key signaling pathways implicated in gliomagenesis. Through advanced ML algorithms, we seek to develop predictive models that accurately identify these pathways, thereby informing personalized therapeutic approaches and improving patient outcomes.
Methodology
Data Collection of MRI scans and Signalling pathways
Our experimental setup commenced by acquiring post-operative scans with multiple parameters from various modalities, comprising T1-weighted (T1w), contrast-enhanced T1-weighted (T1c), fluid-attenuated inversion recovery (FLAIR), and T2-weighted (T2w) images (Fig. 1). These scans were sourced from the BRATS-19 dataset, made available by the Centre for Biomedical Image Computing & Analytics (CBCIA) at the University of Pennsylvania [42,43,44]. The dataset comprised MRI scans obtained from patients diagnosed with both GBM and Low-Grade Glioma (LGG), accompanied by publicly accessible genomic and other clinical data, which can be accessed through platforms such as The Cancer Genome Atlas (TCGA) [35] and Clinical Proteomic Tumour Analysis Consortium (CPTAC) [45]. CBCIA offers a file-name mapping that correlates the provided scans with patient identifiers in TCGA and CPTAC portals, facilitating access to genetic and clinical information from alternative sources. The signaling pathways of the relevant patients were gathered from cBioPortal. This platform offers interactive access to genomic profiles across different datasets and hosts datasets of signaling pathways associated with these profiles. Due to the absence of an API for accessing the pathway dataset, the pathway data was manually extracted using a web scraper. This extraction was performed from the GBM TCGA PanCancer Atlas (Study ID: gbm_tcga_pan_can_atlas_2018), GBM CPTAC (Study ID: gbm_cptac_2021), and Brain Lower Grade Glioma TCGA PanCancer (Study ID: gbm_tcga_pan_can_atlas_2018) datasets. In cases where certain pathways were unavailable in these datasets, they were obtained alternatively from the TCGA Firehose Legacy dataset (Study ID: gbm_tcga, lgg_tcga).
While the training set encompassed MRI scans of LGG, it is noteworthy that GBM and LGG exhibit unique features and certain discrepancies in appearance. However, despite these disparities, the two types of gliomas also display overlapping imaging features and share specific genetic characteristics. Both tumors show increased signal intensity in T2-weighted scans, decreased intensity at T1-weighted imaging, and exhibit contrast enhancement when a contrasting agent is used [46]. The MRI Scans in both cases show infiltrative growth patterns by exhibiting abnormal signal intensity beyond the tumor mass to indicate the spread of the tumor [47]. They show similarities in genetic mutation [48, 49] and also have similarities in the aberrations of their signaling pathways [50, 51].
Radiomic feature extraction of MRI scans
A panel of radiomic features was extracted from the four MRI modalities using the segmentation mask provided for each subject. The extraction process was conducted utilizing PyRadiomics [52], which includes feature definitions that are compliant with the Imaging Biomarker Standardization Initiative (IBSI) [53]. The IBSI standardizes feature definitions and furnishes reference values for verifying radiomic software, enhancing reproducibility, and facilitating the clinical translation of radiomic research. The extracted feature sets underwent standardization to achieve a normal distribution and normalization within the range [0,1]. However, the abundance of extracted features, numbering over a thousand (> 1000), could potentially lead to the “curse of dimensionality.” [54]. Dimensionality reduction and selection of the most relevant features for the outcome model were performed through feature engineering on the generated feature panel.
Data balancing
To address the data imbalance issue in our dataset, we employed the Synthetic Minority Oversampling Technique (SMOTE) [55]. SMOTE utilizes the K-Nearest Neighbors algorithm to identify neighboring feature vectors within the minority class in a given vector space. Subsequently, it generates synthetic data points along the line connecting these neighboring feature vectors of the minority class. This results in an expanded and less narrowly defined decision boundary between the classes, consequently enhancing the performance of classification models. The newly created instance stays within the original feature space, maintaining the dataset’s characteristics and distribution. Furthermore, the generated data introduces extra decision boundaries for a more generalized model, unlike methods such as random oversampling, which merely replicates existing instances.
Model selection and training
Five supervised classification models based on ML were chosen and trained using the provided feature set to forecast the five signaling pathways. The selected algorithms comprise a Logistic Regression Classifier (LRC), Support Vector Machine (SVM), Random Forest Classifier (RFC), AdaBoost Classifier (ABC), and K-Nearest Neighbor Classifier (KNN). To enhance the prediction accuracy of our models, we employed Grid Search for hyperparameter tuning, aiming to determine the optimal hyperparameter configurations for each algorithm. The models underwent 5-fold cross-validation to ensure a more precise and unbiased performance assessment. Subsequently, the models with the most suitable hyperparameter settings were evaluated on separate, unseen test sets. Various evaluation metrics were used to identify each signaling pathway’s top-performing algorithms.
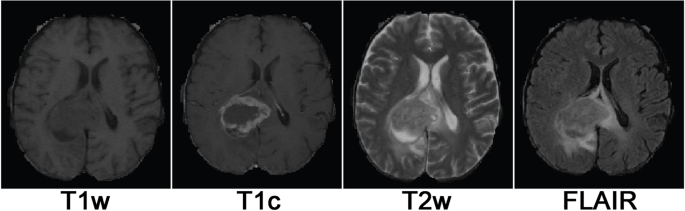
Glioblastoma in various imaging modalities. The tumor part in T1w appears darker, while CSF is highlighted when contrast is added in T1c. The Tumour part appears brighter in T2 and FLAIR sequences
Results
We examine the results of our experiments through cross-validation using four classification algorithms: RFC, SVC, ABC, and LRC. The objective was to detect five specific signaling pathways (WNT, PI3K, TP53, RTK-RAS, NOTCH) across three different datasets: over_sample, under_sample, and under_sample_pure. Our approach involved employing a 5-fold cross-validation technique and evaluating the algorithms’ performance based on accuracy, precision, recall, and F1-score.
MRI scans and segmentation labels
The multi-institutional pre-operative MRI scans for GBM and LGG patients of TCGA (n = 167) and CPTAC (n = 19) were made available in the BRATS-19 dataset released by CBCIA. In addition to containing T1, T2, Post Contrast T1, and FLAIR 3D MRI volumes, the dataset comprises segmentation labels experienced neuro-radiologists have verified. These segmentation labels include annotations for the Enhancing Tumor part (ET), Necrotic and non-enhancing Tumor part (NET), and Peritumoral Edema (ED). The scans have undergone various preprocessing steps, including skull-stripping, co-registration, and interpolation, to achieve a resolution of 1 mm³.
Collection of Signaling pathways and Mapping with MRI scans
Nine oncogenic signaling pathways listed in Table 1 of the feature set were extracted from cBioPortal. However, two pathways, NRF2 and TGF-β, exhibited no alterations and were consequently excluded from further analysis. As depicted in Fig. 2, the distribution of pathway alterations is imbalanced, with either an excess or a scarcity of alterations observed. In situations with a significant disparity between the majority and minority classes, ML algorithms tend to bias their classification outcomes towards the majority class, leading to skewed results [56]. While achieving high accuracy, the algorithm may not perform optimally regarding other performance metrics like sensitivity (recall) or F1-Score. Despite its strong performance, SMOTE may not effectively handle severe imbalances in the data. To tackle this challenge, the top four oncogenic signaling pathways with the least imbalance (< 30%) were chosen for model training. These pathways include PI3K, TP53, RTK-RAS, WNT, and NOTCH signaling pathways, which have been demonstrated to impact GBM significantly [29,30,31,32,33,34, 36,37,38,39,40,41].
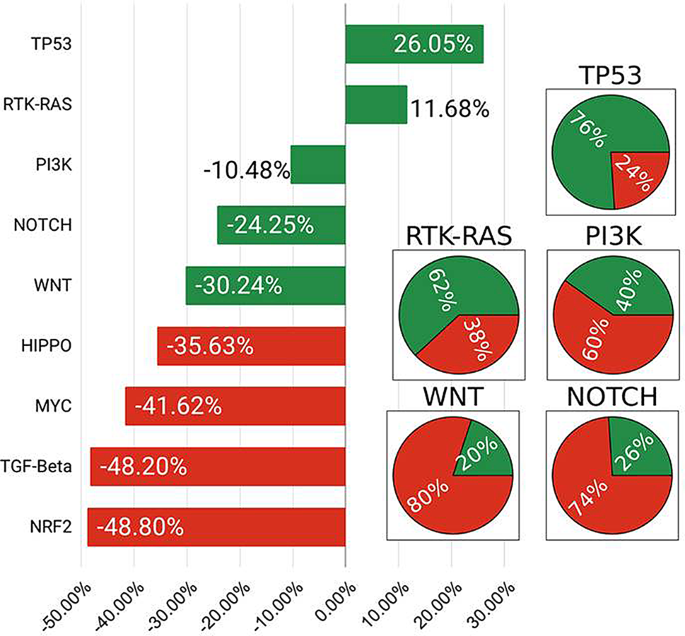
Distribution of alterations in 9 signaling pathways of all subjects in the cohort. The figure shows whether the pathways have alterations of more than half the size of the cohort. Only TP53 and RTK-RAS have more positive alterations than negative alterations. The pie charts show the percentage of positive and negative alterations of the five selected pathways
The RTK-RAS, PI3K, NOTCH, TP53, and WNT signaling pathways are interconnected, with their interactions and cross-regulation playing a substantial role in developing and advancing GBM [29,30,31,32,33,34, 36,37,38,39,40,41]. Recognizing these signaling pathways and understanding the crosstalk between them is essential for administering and advancing targeted therapies. The relationships among signaling pathways across the subjects are depicted in an upset plot in Fig. 3.
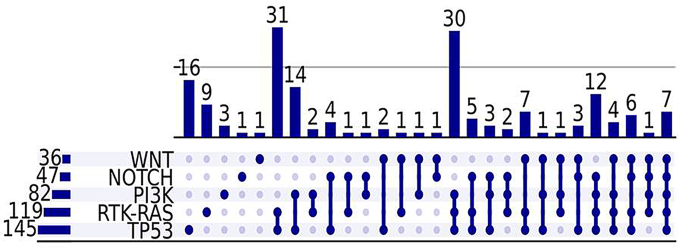
Upset plot showing similarities in Signalling Pathways. Note that there are no intersections among WNT/NOTCH/PI3K, WNT/NOTCH/RTK-RAS, and WNT/NOTCH/PI3K/TP53
Derivation of Radiomic Feature Panel
A comprehensive radiomic feature set of 1284 features, derived from 101 standard features following IBSI standards, was obtained from the four imaging sequences (T1, T2, T1c, FLAIR) along with their corresponding segmentation masks. The extracted features encompassed first-order, volumetric, and intensity-based textural features categorized as First Order, Shape, GLCM, GLDM, GLRLM, GLSZM, and NGTDM, with all 107 features listed in Table 2.
Dimensionality reduction and feature selection
To diminish the dimensionality of the feature set, features exhibiting significant correlation with the target pathway (> 0.1) and minimal correlation with each other (< 0.9) were chosen from the radiomic feature panel. Subsequently, feature importance was assessed for each training set using the random forest algorithm in sklearn with default parameter settings to identify the top 10 most important features. The top 10 features selected for each pathway are presented in Table 3.
Creation of datasets
After preprocessing, feature engineering, and data splitting, the final data cohort consists of 167 subjects from TCGA (GBM = 98, LGG = 69) and 19 from CPTAC. It would have been suitable to set the 19 subjects from CTPAC aside for data validation; however, due to heavy imbalance in the signaling pathways of the CPTAC dataset, the experimentation was carried out on three separate datasets created by splitting the cohort into training and validation sets (Fig. 4).
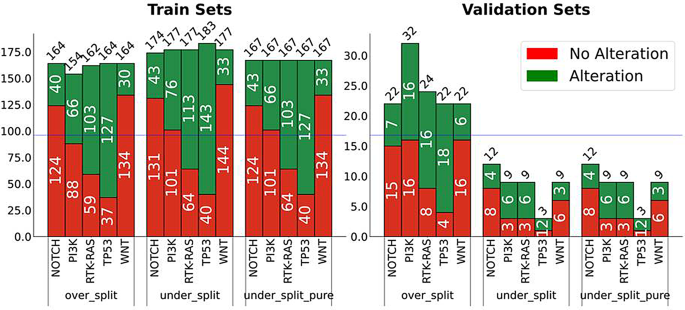
The training and validation data distribution of the three datasets over_split, under_split and under_split_pure
-
i)
In the over_split dataset, the validation set was created by combining samples from the CPTAC dataset with some samples from TCGA. The selection of TCGA samples depended on the availability of samples for the minority class in TCGA. There were specific criteria for constructing this validation set. If the minority class in the CPTAC dataset represented the majority class in TCGA-GBM, then all samples of the minority class from the training set were incorporated into the validation set. Similarly, if the minority class was consistent between TCGA-GBM and CPTAC, samples from TCGA-GBM were chosen for inclusion in the validation set. The number of cases transferred to the validation set depended on the ratio of the majority class to the minority class in TCGA-GBM. If this ratio was less than 0.11, three cases were moved to the validation set; otherwise, five cases were moved to ensure balanced representation. This was done to balance the class distribution.
Given \(\:T={T}_{maj}\cup\:{T}_{min}\:and\:C={C}_{maj}\cup\:{C}_{min}\) as two sets representing TCGA-GBM and CPTAC and a function \(\:\delta\:\)To identify the class of a set, the validation set is generated using the following equation.
-
ii)
The under_split dataset features a validation set comprising solely CPTAC samples, balanced using under-sampling techniques. This involved restricting the number of samples in the majority class to twice that of the minority class. The remaining samples from the majority class were then utilized to augment the size of the training set, thereby enhancing the training process.
-
iii)
The under_split_pure dataset encompassed a validation set comprising exclusively CPTAC samples, which were balanced via under-sampling. This entailed restricting the number of samples in the majority class to twice that of the minority class, with any surplus samples being discarded.
Evaluation of ML models using K-Fold Cross Validation
Five ML algorithms were trained to detect five fundamental oncogenic signaling pathways by training them on diverse radiomic features extracted from segmentation labels of GBM MRI scans. The models underwent training using five-fold cross-validation to assess the generalizability of the employed approach. The mean results of the 5-fold cross-validation of each model across all three datasets in terms of accuracy are tabulated in Table 4 and further visualized for clarity in Fig. 5. In addition to accuracy, the ROC_AUC score was selected to provide a more comprehensive assessment of the models’ performance. The mean results here showcase the optimal parameters achieved through thorough hyperparameter tuning using Grid Search. The precise hyperparameter configuration responsible for these results is outlined in Table 5.
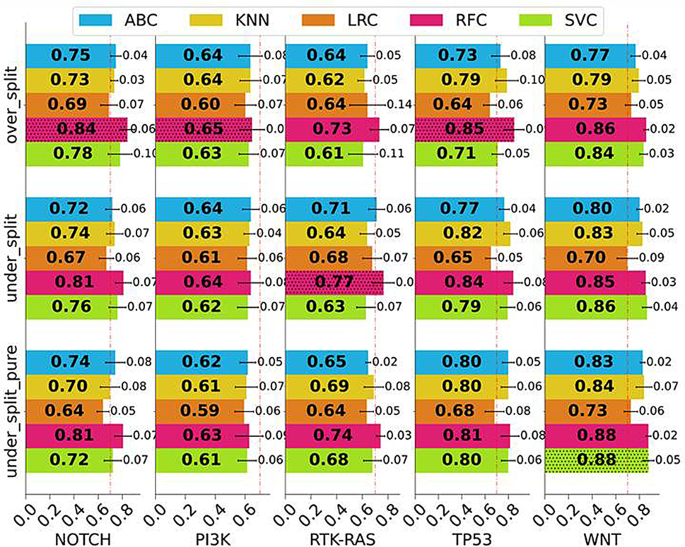
Mean 5-fold Cross-Validation accuracies on the training set for the five signaling pathways with standard deviation represented as error lines over each bar
Model validation on unseen data
The model that performed the best on each signaling pathway was further validated on the test sets set aside to evaluate the generalizability of the models. The following metrics were chosen to give an idea of the general prediction power, showcase the performance on imbalanced data, and observe the trade-off between the correct prediction rate and misclassifications. Accuracy may not be the most suitable metric in classification problems when dealing with moderate to severe data imbalance. Precision, recall (specificity), and F1-score offer a more precise assessment of the models’ performance in such scenarios. Comparative visualizations of the algorithms based on accuracy and F1-score are presented in Fig. 6.
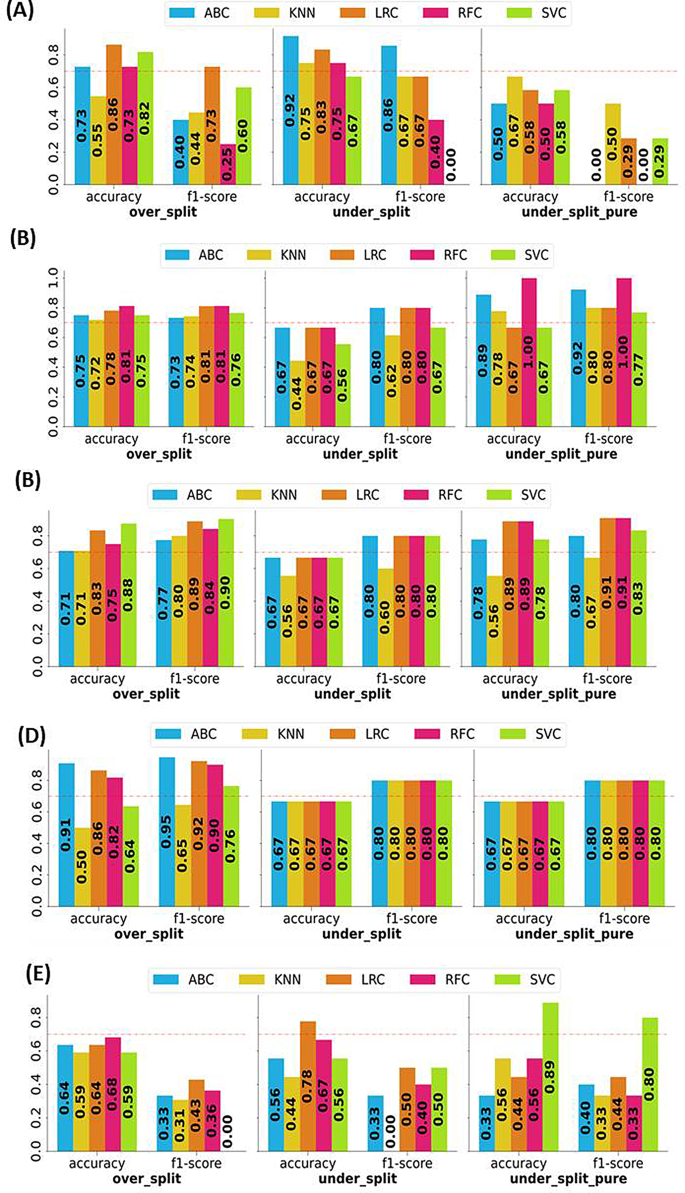
Validation result in terms of accuracy, precision, recall and F1-Score for (a) NOTCH, (b) PI3K, (c) RTK-RAS, (d) TP53 (e) WNT Signalling Pathways on AdaBoost Classifier (ABC), K-Nearest Neighbour (KNN), Logistic Regression Classifier (LRC), Random Forest Classifier (RFC), Support Vector Classifier (SVC)
Discussion and conclusion
Understanding the interconnectedness of signaling pathways like RTK-RAS, PI3K, NOTCH, and TP53 is vital for comprehending how they influence GBM’s development and advancement. Detecting these pathways and their mutual communication is pivotal for administering existing treatments and advancing targeted therapies. Interesting associations can also be seen in our data and shown in the upset plot in Fig. 3. PI3K, RTK-RAS, or TP53 alterations occur independently in no more than three cases each, whereas the NOTCH pathway was observed separately in nine cases and the WNT pathway in 16 cases. Conversely, PI3K, RTK-RAS, and TP53 are often co-present, with various combinations observed. For instance, unique combinations of RTK-RAS and TP53 were found in 31 instances, TP53 with only PI3K in 14 cases, and all three together in 30 cases. These three pathways are well-known for gliomagensis [35, 57, 58]. In addition to the simultaneous presence of established pathways, there are instances where pathways such as NOTCH, which is recognized for inducing apoptosis in the P53 gene, are found alongside the TP53 pathway in 35 cases. The interaction between these pathways is extensively studied and documented [33, 59]. Notably, all four pathways are present in just seven out of the total 167 cases.
The research highlights the significance of carefully selecting algorithms, ensuring data quality, and conducting thorough feature engineering in radio-genomic studies aimed at pathway detection. Each pathway demonstrates distinct interactions and presents specific challenges in this regard. Various ML models demonstrate varying evaluation scores, suggesting that particular pathways may present more complex classification tasks than others. For example, the PI3K pathways seemed more difficult for models to classify accurately, as evidenced by lower precision, recall, and F1-score values. Variations in class distribution also influence model performance, as different representations of classes introduce biases in learning. Specific pathways, like NOTCH and PI3K, seemed to pose more significant challenges for models than others, as reflected in lower precision, recall, and F1-score values. This suggests that the classification boundaries within these pathways are more complex.
The varied performance observed among different ML algorithms corresponds with the distinct challenges presented by each pathway and the size of the dataset. Ensemble methods, notably Random Forest, demonstrated consistent performance across different situations, indicating their potential as dependable baseline models. The TP53 pathway, renowned for its function as a tumor suppressor, yielded exciting findings. When applied to the over_split dataset, the ABC algorithm showed remarkable accuracy, precision, and F1-score, indicating its efficacy in detecting this pathway. However, the algorithm’s efficacy dramatically declined on the under_split and under_split_pure datasets, with most algorithms showing exceptionally low precision and recall, likely due to the minimal test set comprising only three sample points. Conversely, cross-validation accuracy on these two datasets remained consistently above 0.70, except for LRC.
The RTK-RAS pathway, characterized by its intricate network of interactions, displayed diverse performance across different datasets. In the over_split dataset, the SVC exhibited a balanced performance. However, except KNN, all algorithms failed to identify any true negatives, classifying all nine samples as positives, leading to 100% recall but zero precision. This discrepancy contrasts with the cross-validation outcomes on the training set, suggesting that none of the models have overfit and have not achieved successful generalization.
The PI3K pathway, which plays a crucial role in cell growth and survival, exhibited relatively consistent performance trends on under_split_pure and over_split datasets. In the case of over_split, the RFC achieved consistent results across all metrics, reflecting its robustness. However, on the under_split dataset, all algorithms faced challenges detecting any true negatives primarily due to possible class imbalance issues. Interestingly, the RFC algorithm excelled on the under_split_pure dataset, with all 9 cases correctly detected. The NOTCH signaling pathway is known for its significance in gliomagenesis. Across all datasets, we observed consistently higher performance among all the algorithms over all three datasets in the prediction of NOTCH Pathway. The LRC displayed exceptional precision and recall on the over_split and under_split datasets. In contrast, all algorithms failed to perform significantly on the under_split_pure dataset.
The WNT signaling pathway, critical for cell differentiation in the central nervous system, presented diverse performance across algorithms. We had the highest class imbalance and the least number of alterations among the pathways, which performed relatively poorly on all the datasets. RFC showed variable performance across datasets, while the LRC achieved high precision and recall on the under_split dataset. The SVC demonstrated strong performance on the under_split_pure dataset, indicating its capability to handle class imbalance effectively. This research revealed insights into utilizing machine learning models with radiomic data to forecast specific oncogenic signaling pathways. The findings underscore the impact of dataset size, class distribution, and feature complexity on model effectiveness. By considering these elements, we can enhance our prediction algorithms, fostering a deeper understanding of employing AI in radiomics to elucidate the interactions among different signaling pathways and their influence on tumor phenotypic traits.
While this study highlights the potential of using artificial intelligence and radiomics to predicting oncogenic signaling pathways in glioblastoma, the study relies on publicly available datasets, such as BRATS-19 and TCGA, which may not represent the full heterogeneity of glioblastoma cases. Limited sample sizes, particularly for certain signaling pathways, have introduced class imbalance. Despite using techniques like SMOTE to address this issue, synthetic data generation may not fully capture the complexity of real-world tumor biology, potentially affecting model performance on underrepresented pathways. Furthermore, while cross-validation was used to mitigate overfitting, external validation on independent datasets could confirm the models’ reliability and applicability in diverse clinical settings.
Predicting oncogenic signaling pathways from radiomic features holds promise for advancing genomic diagnosis faster and more cost-effectively. Invasive diagnostic procedures for brain tumors, such as brain biopsies, entail additional risks, making the timely and accurate genetic profiling of specimens crucial for targeted therapeutic interventions in Glioblastoma cases. The study offers a non-invasive approach to identifying oncogenic signaling pathways, which can guide personalized therapeutic strategies which is clinically significant since this advancement could reduce reliance on invasive diagnostic procedures like biopsies, thereby mitigating associated risks. Our study deployed four machine-learning models to forecast four oncogenic signaling pathways using MRI scans from the TCGA-GBM dataset (Fig. 7). Our findings revealed a positive correlation between the radiomic features extracted from MRI scans and oncogenic signaling pathways in GBM. With adequate data, manual feature extraction could be bypassed, leading to the development of a more generalized multi-label deep learning model capable of predicting additional signaling pathways. We intend to expand this research by developing a multi-label deep learning model that can predict a broader spectrum of signaling pathways. Future applications could also include extending the research beyond glioblastoma to other cancer types, which could help in improving patient outcomes in diverse clinical contexts.
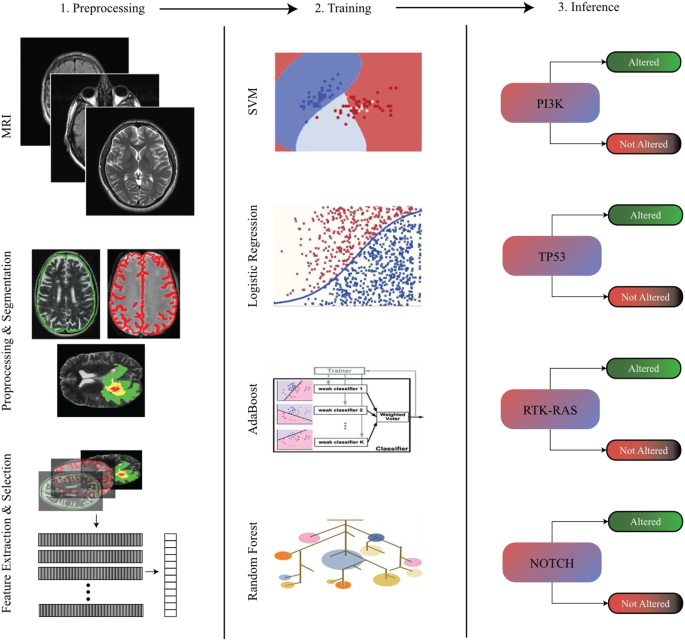
Study pipeline illustrating the integration of radiogenomics and machine learning for predicting oncogenic pathway alterations in glioblastoma
Availability of supporting data
Not Applicable.
References
Grochans S, Cybulska AM, Simińska D, Korbecki J, Kojder K, Chlubek D, Baranowska-Bosiacka I. Epidemiology of glioblastoma multiforme–literature review. Cancers. 2022;14(10):2412.
Lu I-N, Dobersalske C, Rauschenbach L, Teuber-Hanselmann S, Steinbach A, Ullrich V, Prasad S, Blau T, Kebir S, Siveke JT. Tumor-associated hematopoietic stem and progenitor cells positively linked to glioblastoma progression. Nat Commun. 2021;12(1):3895.
Kim HJ, Park JW, Lee JH. Genetic architectures and cell-of-origin in glioblastoma. Front Oncol. 2021;10:615400.
Melhem JM, Detsky J, Lim-Fat MJ, Perry JR. Updates in IDH-wildtype glioblastoma. Neurotherapeutics. 2022;19(6):1705–23.
Tykocki T, Eltayeb M. Ten-year survival in glioblastoma. A systematic review. J Clin Neurosci. 2018;54:7–13.
Patel NP, Lyon KA, Huang JH. The effect of race on the prognosis of the glioblastoma patient: a brief review. Neurol Res. 2019;41(11):967–71.
Bai J, Varghese J, Jain R. Adult glioma WHO classification update, genomics, and imaging: what the radiologists need to know. Top Magn Reson Imaging. 2020;29(2):71–82.
Louis DN, Perry A, Wesseling P, Brat DJ, Cree IA, Figarella-Branger D, Hawkins C, Ng H, Pfister SM, Reifenberger G. The 2021 WHO classification of tumors of the central nervous system: a summary. Neurooncology. 2021;23(8):1231–51.
McNeill KA. Epidemiology of brain tumors. Neurol Clin. 2016;34(4):981–98.
Ostrom QT, Gittleman H, Farah P, Ondracek A, Chen Y, Wolinsky Y, Stroup NE, Kruchko C, Barnholtz-Sloan JS. CBTRUS statistical report: primary brain and central nervous system tumors diagnosed in the United States in 2006–2010. Neurooncology. 2013;15(suppl2):ii1–56.
Chakrabarti I, Cockburn M, Cozen W, Wang YP, Preston-Martin S. A population‐based description of glioblastoma multiforme in Los Angeles County, 1974–1999. Cancer: Interdisciplinary Int J Am Cancer Soc. 2005;104(12):2798–806.
Ostrom QT, Gittleman H, Truitt G, Boscia A, Kruchko C, Barnholtz-Sloan JS. CBTRUS statistical report: primary brain and other central nervous system tumors diagnosed in the United States in 2011–2015. Neuro-oncology 2018, 20(suppl_4):iv1-iv86.
Ostrom QT, Price M, Neff C, Cioffi G, Waite KA, Kruchko C, Barnholtz-Sloan JS. CBTRUS Statistical Report: primary brain and other Central Nervous System tumors diagnosed in the United States in 2015–2019. Neuro Oncol. 2022;24(Suppl 5):v1–95.
Bi WL, Hosny A, Schabath MB, Giger ML, Birkbak NJ, Mehrtash A, Allison T, Arnaout O, Abbosh C, Dunn IF. Artificial intelligence in cancer imaging: clinical challenges and applications. Cancer J Clin. 2019;69(2):127–57.
Hussain T, Nguyen QT. Molecular imaging for cancer diagnosis and surgery. Adv Drug Deliv Rev. 2014;66:90–100.
Chen C-C, Hsu P-W, Wu T-WE, Lee S-T, Chang C-N, Wei K-c, Chuang C-C, Wu C-T, Lui T-N, Hsu Y-H. Stereotactic brain biopsy: single center retrospective analysis of complications. Clin Neurol Neurosurg. 2009;111(10):835–9.
Shui L, Ren H, Yang X, Li J, Chen Z, Yi C, Zhu H, Shui P. The era of radiogenomics in precision medicine: an emerging approach to support diagnosis, treatment decisions, and prognostication in oncology. Front Oncol. 2021;10:570465.
Bodalal Z, Trebeschi S, Nguyen-Kim TDL, Schats W, Beets-Tan R. Radiogenomics: bridging imaging and genomics. Abdom Radiol. 2019;44(6):1960–84.
Sundaram M, McGuire MH, Herbold DR. Magnetic resonance imaging of soft tissue masses: an evaluation of fifty-three histologically proven tumors. Magn Reson Imaging. 1988;6(3):237–48.
Upadhyay N, Waldman A. Conventional MRI evaluation of gliomas. Br J Radiol. 2011;84(specialissue2):S107–11.
Zinn PO, Singh SK, Kotrotsou A, Hassan I, Thomas G, Luedi MM, Elakkad A, Elshafeey N, Idris T, Mosley J. A coclinical radiogenomic validation study: conserved magnetic resonance radiomic appearance of periostin-expressing glioblastoma in patients and xenograft models. Clin Cancer Res. 2018;24(24):6288–99.
Pei L, Vidyaratne L, Rahman MM, Iftekharuddin KM. Context aware deep learning for brain tumor segmentation, subtype classification, and survival prediction using radiology images. Sci Rep. 2020;10(1):19726.
Li K, Xiao J, Yang J, Li M, Xiong X, Nian Y, Qiao L, Wang H, Eresen A, Zhang Z. Association of radiomic imaging features and gene expression profile as prognostic factors in pancreatic ductal adenocarcinoma. Am J Translational Res. 2019;11(7):4491.
Sever R, Brugge JS. Signal transduction in cancer. Cold Spring Harbor Perspect Med. 2015;5(4):a006098.
Villanueva A, García C, Paules AB, Vicente M, Megías M, Reyes G, de Villalonga P, Agell N, Lluís F, Bachs O. Disruption of the antiproliferative TGF-β signaling pathways in human pancreatic cancer cells. Oncogene. 1998;17(15):1969–78.
Mendoza MC, Er EE, Blenis J. The Ras-ERK and PI3K-mTOR pathways: cross-talk and compensation. Trends Biochem Sci. 2011;36(6):320–8.
Samimi H, Fallah P, Sohi AN, Tavakoli R, Naderi M, Soleimani M, Larijani B, Haghpanah V. Precision medicine approach to anaplastic thyroid cancer: advances in targeted drug therapy based on specific signaling pathways. Acta Medica Iranica 2017:200–8.
Zhu P, Aliabadi HM, Uludağ H, Han J. Identification of potential drug targets in cancer signaling pathways using stochastic logical models. Sci Rep. 2016;6(1):23078.
Mischel PS, Nelson SF, Cloughesy TF. Molecular analysis of glioblastoma: pathway profiling and its implications for patient therapy. Cancer Biol Ther. 2003;2(3):242–7.
Pearson JR, Regad T. Targeting cellular pathways in glioblastoma multiforme. Signal Transduct Target Therapy. 2017;2(1):1–11.
Bazzoni R, Bentivegna A. Role of notch signaling pathway in glioblastoma pathogenesis. Cancers. 2019;11(3):292.
Gaiano N, Fishell G. The role of notch in promoting glial and neural stem cell fates. Annu Rev Neurosci. 2002;25(1):471–90.
Yang X, Klein R, Tian X, Cheng H-T, Kopan R, Shen J. Notch activation induces apoptosis in neural progenitor cells through a p53-dependent pathway. Dev Biol. 2004;269(1):81–94.
Sanchez-Vega F, Mina M, Armenia J, Chatila WK, Luna A, La KC, Dimitriadoy S, Liu DL, Kantheti HS, Saghafinia S. Oncogenic signaling pathways in the cancer genome atlas. Cell. 2018;173(2):321–37. e310.
1 CGARNTDUMSMRFABD, 5 EUVMEGBDJMMGOJJ, 8 HFHMTLN, 11 MACCAKAYWBO. 13 UoCSFVSBMPM: Comprehensive genomic characterization defines human glioblastoma genes and core pathways. Nature 2008, 455(7216):1061–1068.
Fonseca COd, Linden R, Futuro D, Gattass CR, Quirico-Santos T. Ras pathway activation in gliomas: a strategic target for intranasal administration of perillyl alcohol. Arch Immunol Ther Exp. 2008;56:267–76.
Lee Y, Lee J-K, Ahn SH, Lee J, Nam D-H. WNT signaling in glioblastoma and therapeutic opportunities. Lab Invest. 2016;96(2):137–50.
Komiya Y, Habas R. Wnt signal transduction pathways. Organogenesis. 2008;4(2):68–75.
Guan R, Zhang X, Guo M. Glioblastoma stem cells and wnt signaling pathway: molecular mechanisms and therapeutic targets. Chin Neurosurgical J. 2020;6:1–6.
Zuccarini M, Giuliani P, Ziberi S, Carluccio M, Di Iorio P, Caciagli F, Ciccarelli R. The role of wnt signal in glioblastoma development and progression: a possible new pharmacological target for the therapy of this tumor. Genes. 2018;9(2):105.
Kabir MH, Patrick R, Ho JW, O’Connor MD. Identification of active signaling pathways by integrating gene expression and protein interaction data. BMC Syst Biol. 2018;12:77–87.
Menze BH, Jakab A, Bauer S, Kalpathy-Cramer J, Farahani K, Kirby J, Burren Y, Porz N, Slotboom J, Wiest R. The multimodal brain tumor image segmentation benchmark (BRATS). IEEE Trans Med Imaging. 2014;34(10):1993–2024.
Bakas S, Akbari H, Sotiras A, Bilello M, Rozycki M, Kirby JS, Freymann JB, Farahani K, Davatzikos C. Advancing the cancer genome atlas glioma MRI collections with expert segmentation labels and radiomic features. Sci data. 2017;4(1):1–13.
Bakas S, Reyes M, Jakab A, Bauer S, Rempfler M, Crimi A, Shinohara RT, Berger C, Ha SM, Rozycki M. Identifying the best machine learning algorithms for brain tumor segmentation, progression assessment, and overall survival prediction in the BRATS challenge. arXiv Preprint arXiv:181102629 2018.
Whiteaker JR, Halusa GN, Hoofnagle AN, Sharma V, MacLean B, Yan P, Wrobel JA, Kennedy J, Mani D, Zimmerman LJ. CPTAC Assay Portal: a repository of targeted proteomic assays. Nat Methods. 2014;11(7):703–4.
Haydar N, Alyousef K, Alanan U, Issa R, Baddour F, Al-Shehabi Z, Al-Janabi MH. Role of Magnetic Resonance Imaging (MRI) in grading gliomas comparable with pathology: a cross-sectional study from Syria. Annals Med Surg. 2022;82:104679.
Guillevin R, Herpe G, Verdier M, Guillevin C. Low-grade gliomas: the challenges of imaging. Diagn Interv Imaging. 2014;95(10):957–63.
Aoki K, Nakamura H, Suzuki H, Matsuo K, Kataoka K, Shimamura T, Motomura K, Ohka F, Shiina S, Yamamoto T. Prognostic relevance of genetic alterations in diffuse lower-grade gliomas. Neurooncology. 2018;20(1):66–77.
Paugh BS, Qu C, Jones C, Liu Z, Adamowicz-Brice M, Zhang J, Bax DA, Coyle B, Barrow J, Hargrave D. Integrated molecular genetic profiling of pediatric high-grade gliomas reveals key differences with the adult disease. J Clin Oncol. 2010;28(18):3061.
Nasrolahi A, Azizidoost S, Radoszkiewicz K, Najafi S, Ghaedrahmati F, Anbiyaee O, Khoshnam SE, Farzaneh M, Uddin S. Signaling pathways governing glioma cancer stem cells behavior. Cell Signal. 2023;101:110493.
Nakada M, Kita D, Watanabe T, Hayashi Y, Teng L, Pyko IV, Hamada J-I. Aberrant signaling pathways in glioma. Cancers. 2011;3(3):3242–78.
Van Griethuysen JJ, Fedorov A, Parmar C, Hosny A, Aucoin N, Narayan V, Beets-Tan RG, Fillion-Robin J-C, Pieper S, Aerts HJ. Computational radiomics system to decode the radiographic phenotype. Cancer Res. 2017;77(21):e104–7.
Zwanenburg A, Leger S, Vallières M, Löck S. Image biomarker standardisation initiative. arXiv Preprint arXiv:161207003 2016.
Limkin EJ, Sun R, Dercle L, Zacharaki EI, Robert C, Reuzé S, Schernberg A, Paragios N, Deutsch E, Ferté C. Promises and challenges for the implementation of computational medical imaging (radiomics) in oncology. Ann Oncol. 2017;28(6):1191–206.
Chawla NV, Bowyer KW, Hall LO, Kegelmeyer WP. SMOTE: synthetic minority over-sampling technique. J Artif Intell Res. 2002;16:321–57.
Krawczyk B. Learning from imbalanced data: open challenges and future directions. Progress Artif Intell. 2016;5(4):221–32.
Venkatesan S, Lamfers ML, Dirven CM, Leenstra S. Genetic biomarkers of drug response for small-molecule therapeutics targeting the RTK/Ras/PI3K, p53 or rb pathway in glioblastoma. CNS Oncol. 2016;5(2):77–90.
Han S, Wang P-F, Cai H-Q, Wan J-H, Li S-W, Lin Z-H, Yu C-J, Yan C-X. Alterations in the RTK/Ras/PI3K/AKT pathway serve as potential biomarkers for immunotherapy outcome of diffuse gliomas. Aging. 2021;13(11):15444.
Dotto GP. Crosstalk of notch with p53 and p63 in cancer growth control. Nat Rev Cancer. 2009;9(8):587–95.
Funding
This study was funded, in part, by a Research Grant (Grant number: ID No. 2022–16465) from the Indian Council of Medical Research (ICMR) Govt. of India, New Delhi to Muzafar A. Macha. Promotion of University Research and Scientific Excellence (PURSE) (SR/PURSE/2022/121) grant from the Department of Science and Technology, Govt. of India, New Delhi to the Islamic University of Science and Technology (IUST), Awantipora.
Author information
Authors and Affiliations
Contributions
ABA, SWA, MRB, and MAM wrote the manuscript and generated figures. TAM, AA, MAM, and MRB contributed to the concept and design and critically edited the manuscript. ABA, SWA, and TAM performed experiments. ABA, SWA, TAM, AS, MAK, AAB, AS, MRB, and MAM critically revised and edited the scientific content. All authors read and approved the final manuscript.
Corresponding authors
Ethics declarations
Ethical approval and consent to participate
Not Applicable.
Consent for publication
Not Applicable.
Competing interests
The authors declare that they have no competing interests.
Additional information
Publisher’s note
Springer Nature remains neutral with regard to jurisdictional claims in published maps and institutional affiliations.
Electronic supplementary material
Below is the link to the electronic supplementary material.
Rights and permissions
Open Access This article is licensed under a Creative Commons Attribution-NonCommercial-NoDerivatives 4.0 International License, which permits any non-commercial use, sharing, distribution and reproduction in any medium or format, as long as you give appropriate credit to the original author(s) and the source, provide a link to the Creative Commons licence, and indicate if you modified the licensed material. You do not have permission under this licence to share adapted material derived from this article or parts of it. The images or other third party material in this article are included in the article’s Creative Commons licence, unless indicated otherwise in a credit line to the material. If material is not included in the article’s Creative Commons licence and your intended use is not permitted by statutory regulation or exceeds the permitted use, you will need to obtain permission directly from the copyright holder. To view a copy of this licence, visit http://creativecommons.org/licenses/by-nc-nd/4.0/.
About this article

Cite this article
Ahanger, A.B., Aalam, S.W., Masoodi, T.A. et al. Radiogenomics and machine learning predict oncogenic signaling pathways in glioblastoma. J Transl Med 23, 121 (2025). https://doiorg.publicaciones.saludcastillayleon.es/10.1186/s12967-025-06101-5
Received:
Accepted:
Published:
DOI: https://doiorg.publicaciones.saludcastillayleon.es/10.1186/s12967-025-06101-5